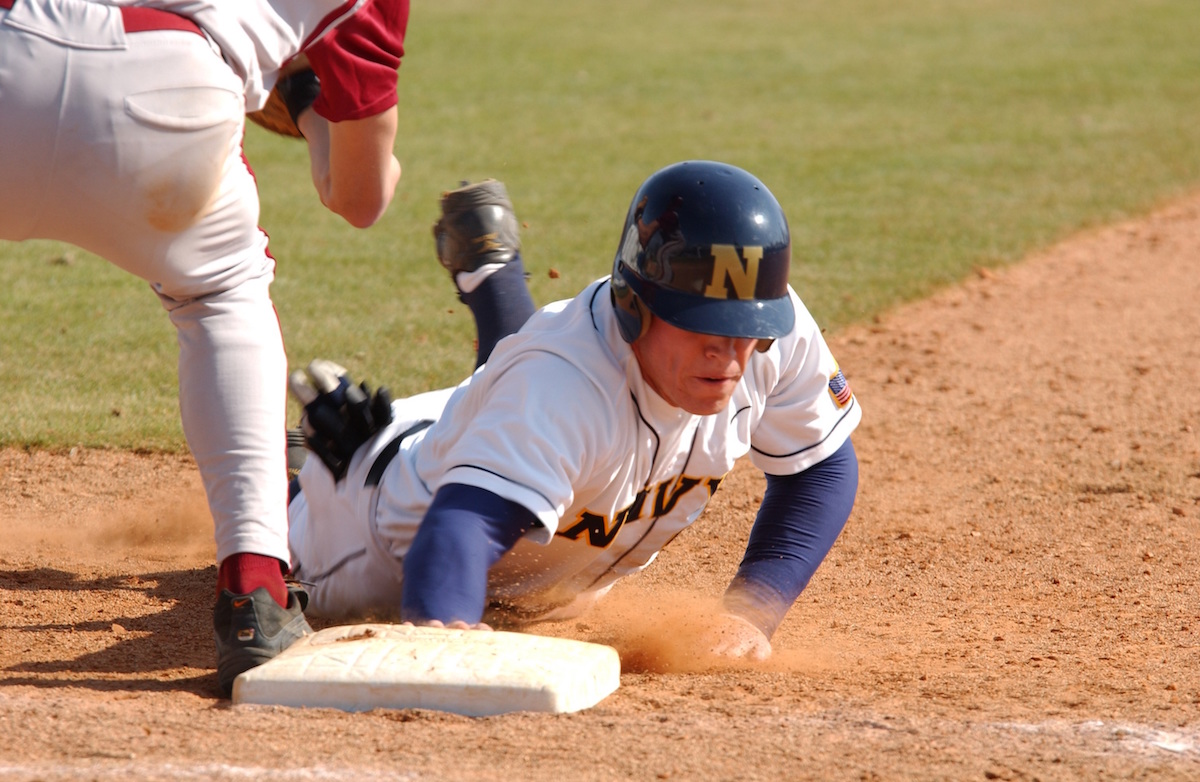
There is a lot of research out there looking at soccer and basketball and the distances covered by athletes in games. Not only that, but this information is often broken down by position type and by running speeds. This is a powerful tool for the development of both metabolic conditioning programs, small sided games, scrimmages, and speed training programs.
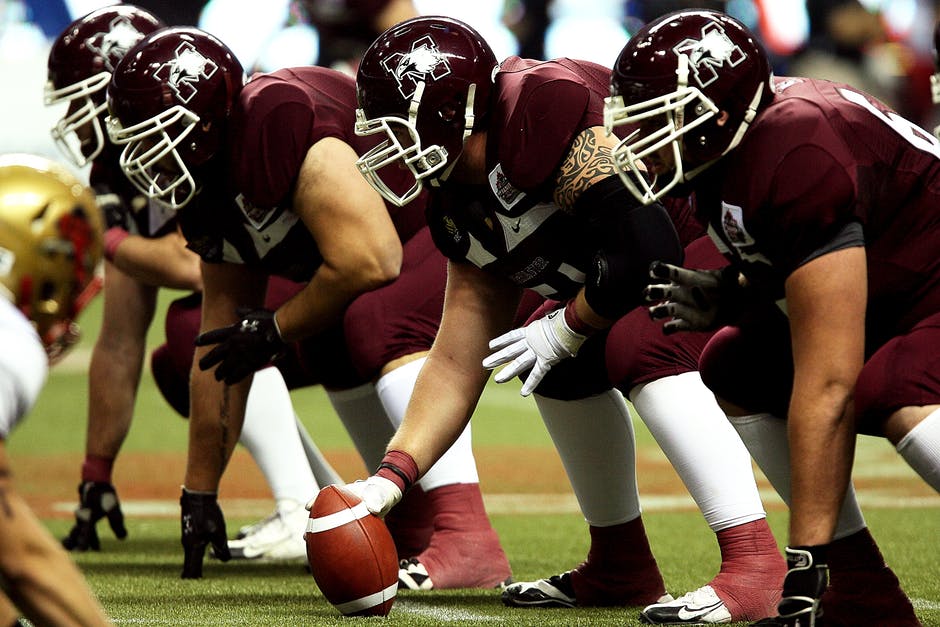
In American football, there is a paucity of information on this and nothing recent. In the Journal of Strength and Conditioning Research, Sanders et al published a study doing exactly this using division I college football players.
The authors studied a division I football team. Athletes wore sensors to track their distance and speeds in games. Only those athletes who participated in at least 75% of the offensive or defensive plays were studied. The study lasted the entire season (i.e. every game was studied).
While studying this, the authors broke down player speeds into four categories (from slowest to fastest). In the results below I’m only reporting on the slowest and the fastest categories, note that there are two intermediate categories that I’m not reporting on.
Results:
Note that the results below are the mean per-game result, these numbers fluctuated from game to game (i.e. these are averages…).
Looking at the defensive side of the ball:
- Defensive backs covered the most distance in a game at approximately 4300 meters. Of that a little over 12% was at the fastest speeds, almost 80% was at the slowest.
- Linebackers covered the second most total distance in a game at approximately 3600 meters. Of that, almost 10% was at the fastest speeds and a little over 82% was at the slowest.
- Defensive linemen covered the least total distance in a game at approximately 3400 meters. Of that a little over 2% was at the fastest speeds, almost 90% at the slowest.
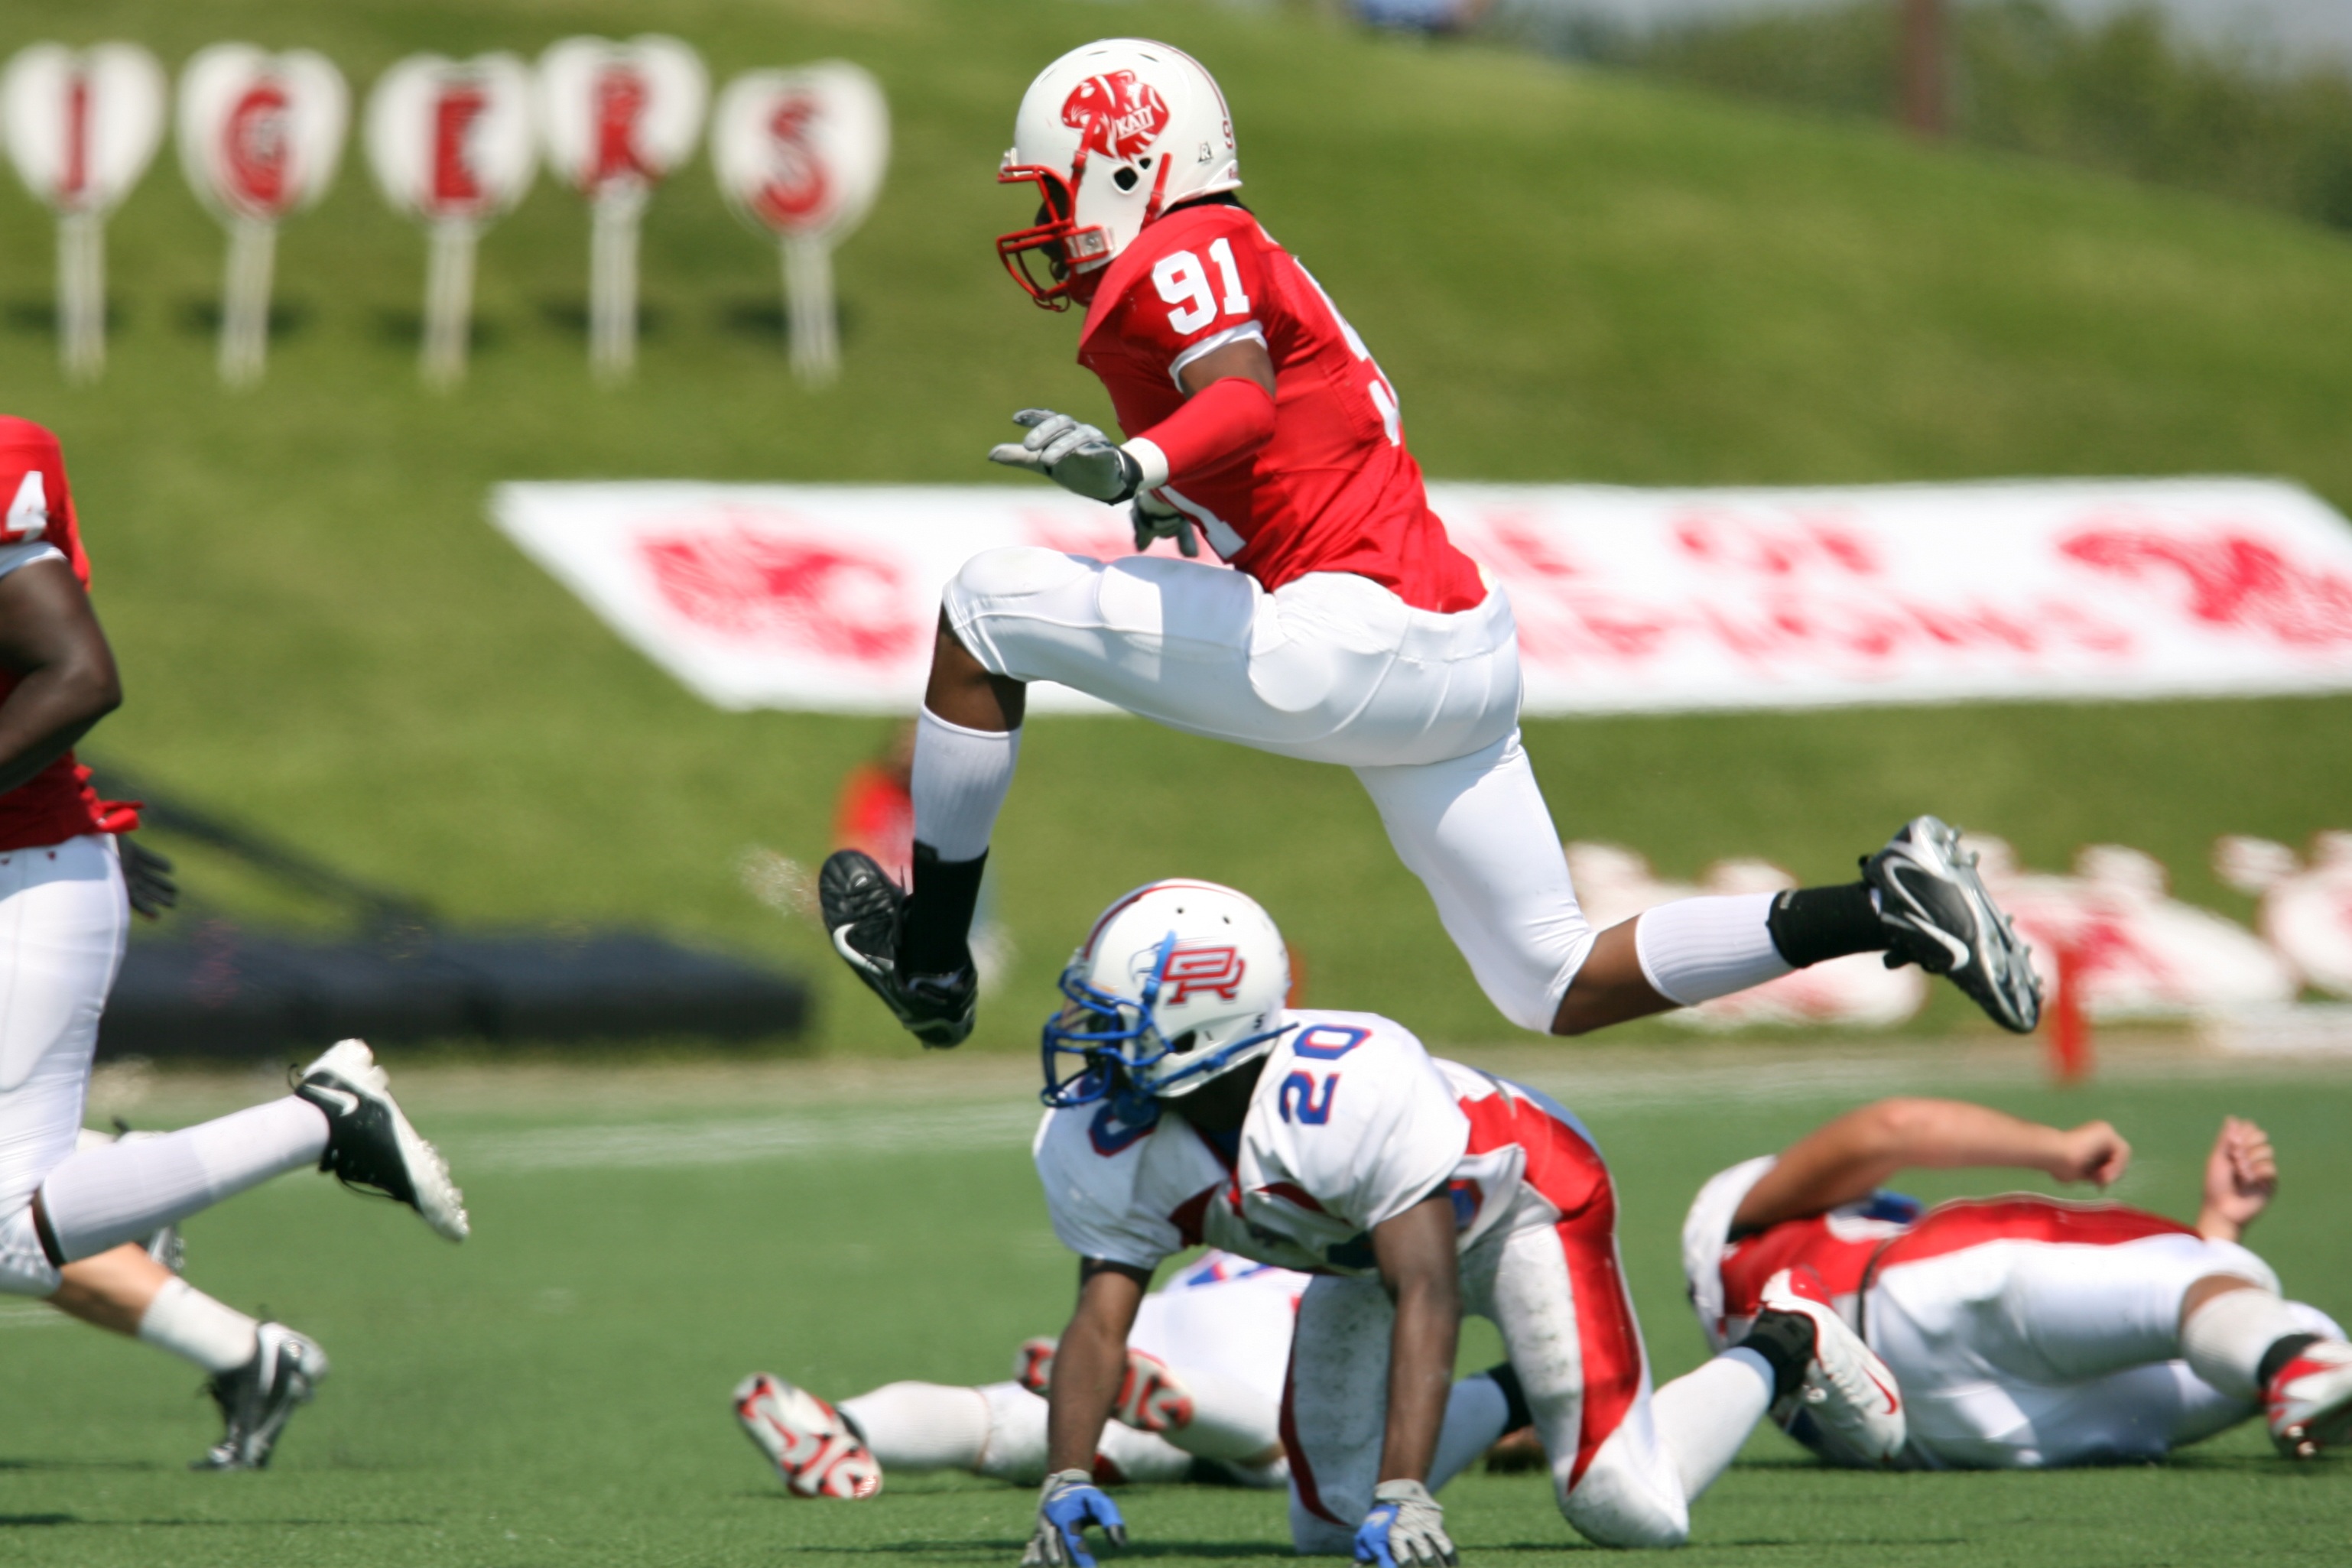
Looking at the offensive side of the ball:
- Tight ends covered the most distance in a game at a little more than 4900 meters. Of that, almost 11% was at the fastest speeds, almost 80% at the slowest.
- Wide receivers covered the second most distance in a game with a little more than 4400 meters. Of that, a little over 11% was at the fastest speeds with almost 80% at the slowest.
- Quarterbacks covered the third most distance in a game at around 4000 meters, with approximately 4% at the fastest speeds and almost 91% at the slowest.
- Offensive linemen covered the fourth most distance in a game with almost 3200 meters. Of that, less than 1% was at the fastest speeds and almost 94% was at the slowest.
- Finally, running backs covered the fifth most total distance in a game at almost 3000 meters. Of that, almost 8% was at the fastest speeds and almost 84% at the slowest.
Now, this is going to be different based upon age range (youth, high school, college, pro, etc.), offensive and defensive philosophies, the personnel available, the game plan, etc. But, I find the results fascinating for a number of reasons. First, I would figure that there would be more distance covered at the highest speeds for most positions. Second, I’m surprised at how the offensive positions ranked. Third, the offensive/defensive linemen and the percentage of distance at the fastest speeds are really interesting.
What use is this information? First, using this particular school as a basis for your team’s program is not a good idea. Your team is different. But, you can collect this type of information, even without technology using the eyeball test, and use it to direct your program’s conditioning and speed work. Second, this type of information can be important in helping you develop testing that is specific to the type of program you run.
For example, in your program you find that your defensive backs are covering (on average) 500 meters a game at the fastest speeds. This happens ten times a game (i.e. 50 meters each time). This lets you know that a 50 meter sprint would be a good way to assess the speeds of defensive backs in your program and this can be one criteria (of many) to help determine who is on the time and who is starting.
Sanders, G.J., Roll, B., and Peacock, C.A. (2017). Maximum distance and high-speed distance demands by position in NCAA division I collegiate football games. Journal of Strength and Conditioning Research, 31(10), 2728-2733.